Build a Token-Cost Worksheet That Sets Your Inference Price Floor
A six-line worksheet turns accelerator economics into a defensible token price floor before you price inference.
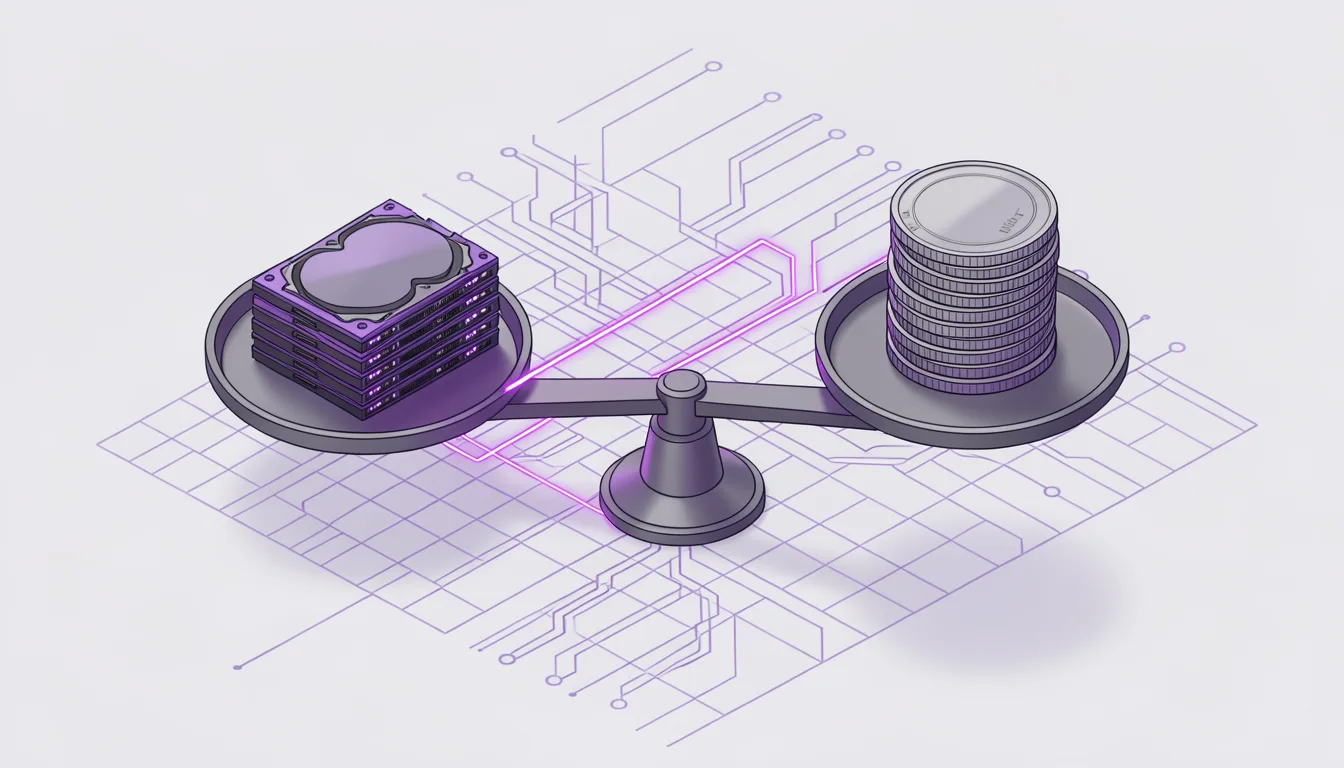
The trade-off is not whether a faster accelerator looks impressive in a demo. It is whether your fleet can sustain enough useful tokens per watt, at enough utilization, to make the token price floor lower than the price you can charge. If the answer is no, a cheaper accelerator or a better scheduler may beat a bigger model. The arithmetic is simple: total cost divided by tokens produced sets the floor. Everything else is margin.
That is why NVIDIA increasingly describes a data center not as a place that stores servers, but as an AI factory.
Why cost per token is the real margin line
For inference, the operating metric that connects engineering to finance is cost per token. NVIDIA's token-economics materials treat that metric as a key operating metric tied to inference pricing and profitability.
The underlying metrics are not decorative. Tokens per watt tells you energy efficiency. Utilization tells you how much paid-for capacity is producing useful work. Uptime tells you how much of the fleet is available when customers need it. Cost per token is the result after all of those forces collide.
GPU utilization is the hidden variable because it is easy to hide in a dashboard. If the network stalls, memory cannot feed compute fast enough, or software schedules workloads poorly, then theoretical GPU performance becomes irrelevant.
The worksheet: six lines that set a floor
Build the worksheet in six lines. Keep it in the same units your finance team uses, and express the final answer in US dollars per token. Do not start with a vendor quote; start with measured production behavior.
- Tokens per second per node. Measure output tokens over a sustained window under your real traffic mix. Include prompt length, output length, batching behavior, and model version. If you serve multiple models, record tokens per second for each model class, not just the flagship.
- Tokens per watt. Divide measured tokens per second by node power draw. Include the accelerator, memory, CPU, storage, and network interfaces in the node definition. This line exposes whether a faster accelerator is improving energy efficiency or only peak throughput.
- Sustained utilization. Measure the share of available compute time spent producing useful tokens. Do not use peak utilization. Use the window that matches your pricing cycle. If utilization is low, the problem may be demand shaping, scheduling, batching, or capacity sizing, not model quality.
- Power, cooling, and networking costs. Add the energy cost for compute and network, the cooling overhead, and the amortized cost of the network fabric. Cooling is not a footnote: the capital costs in an AI factory include accelerators, networking, buildings, transformers, cooling, power generation, and financing.
- Fleet mix. Weight each model, hardware class, and region by the share of tokens it serves. A fleet is not one machine. It is a portfolio of cost curves. If a small model handles most traffic, its cost per token may dominate your blended floor even if the large model gets the marketing attention.
- Token price floor. Divide total cost by total tokens. Total cost should include amortized capital, power, cooling, networking, and the operating overhead required to keep the fleet available. The result is the minimum price that covers production cost. It is not a target margin. It is the line below which you are buying growth with losses.
The arithmetic is the point. If total cost is C and total tokens are T, the floor is C divided by T. If you change the fleet mix, the formula does not change; the inputs do. That is why the worksheet beats a one-off benchmark. It forces the team to state which assumptions moved: throughput, efficiency, utilization, power, or mix.
How to use it before pricing
Use the worksheet in three places. First, before committing to a new accelerator or model deployment, ask what the floor becomes under the projected traffic mix. If the floor is above the price you can charge, the deployment is a margin problem, not a technical problem. Second, use it to compare serving options: a smaller model with lower tokens per second can beat a larger model if its tokens per watt and utilization are better. Third, use it to set internal alerts: if measured cost per token drifts above the floor you used in pricing, the team needs to know before the next revenue forecast.
Start with the current fleet. Measure tokens per second, tokens per watt, utilization, and power for one production workload. Build the six-line worksheet. Then compare it to the price you charge. If the floor is close to the price, your margin is thinner than it looks. If the floor is far below the price, you have room to invest in scheduling, batching, or fleet mix. The goal is to know, before the next pricing decision, whether the stack can produce tokens cheap enough to survive.